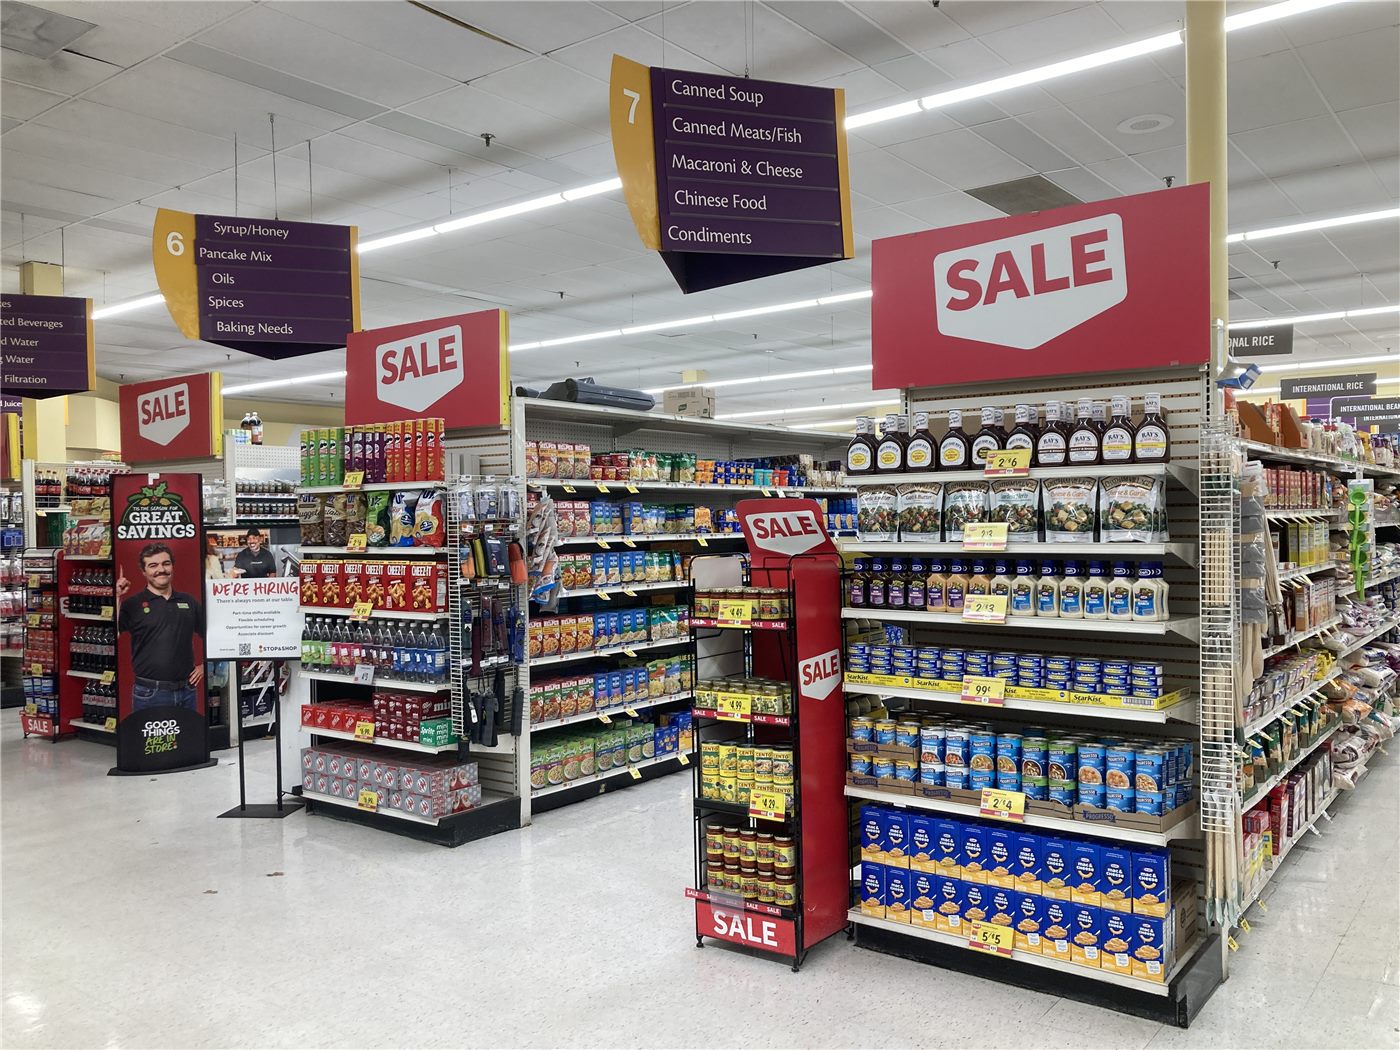
Walmart, the world's largest retailer, reported second-quarter results on Aug. 20 showing US comparable sales up 2.6 percent, well short of the 3.7 percent analysts expected and the weakest rate since the fourth quarter of 2020. Total revenue rose 5.9 percent from a year earlier to $187.9 billion, but guidance for third-quarter adjusted earnings per share came in below market forecasts and the shares fell as much as 9 percent during the session, the steepest one-day drop since May 2022.
Where the numbers diverged
Profit and sales pointed in different directions. Adjusted earnings per share of $0.81 beat expectations and the company raised its full-year outlook. What investors fixed on was US comparable sales growth, the measure of sales at stores open more than a year, read as a thermometer for retail demand.
광고 문의 · 300×250The company said shoppers are making "trade-offs." With fuel and staple prices still elevated, more customers are calculating what to leave out of the basket. Changes tied to prescription drug pricing also weighed on sales. E-commerce growth eased from 26 percent in the first quarter to 24 percent in the second.
That roughly $2.9 billion of the profit improvement came from a tariff refund also split opinion. A one-off item lifting earnings is not the same as improvement in the underlying business, analysts noted.
Why one company's results are read as an indicator
Walmart serves about 280 million customers and members each week. Because so much of American household spending on groceries and household goods passes through its checkouts, its results have long been treated as a consumption gauge rather than a single company's scorecard.
In New York the relief produced a day earlier by expanded Treasury buybacks lasted exactly one day. Yields turned higher again and all three main indices fell. European markets mostly closed lower with inflation worries unresolved. Taiwan index futures failed to regain the 45,000 level in the night session and turned negative.
There is a reading in the other direction. Raising the full-year outlook expresses confidence about second-half demand, and some analysis after the release framed the question as whether the $100 share level holds.
The line that runs to Asia
A slowdown in American retail demand reaches Asian supply chains on a lag. Container volumes, order lead times and the size of orders placed for the year-end peak adjust in sequence. Korean and Taiwanese export figures have held up on semiconductor and artificial intelligence demand, which is a separate axis from consumer goods.
Taiwan's ministry of economic affairs reported July export orders of $97.9 billion, a fresh record, driven by AI servers and related components. Softening consumer demand and expanding AI investment are coexisting in the same quarter. When the two lines meet is the question for Asian manufacturing in the second half.
For small and mid-sized Korean exporters supplying American retail chains, and for ethnic Chinese merchants who have run wholesale and distribution businesses in Incheon and Seoul, the figure is not an abstraction. They have repeatedly seen order sizes and payment terms change first, with the statistics arriving afterwards.
A third perspective
Hwagyo Sibo is careful about turning one set of results into a verdict on the economy. Confirmed: US comparable sales growth of 2.6 percent against an expected 3.7 percent, guidance below forecasts for the third quarter, and $2.9 billion in tariff refunds flowing into profit. Not confirmed: how many quarters this softness runs, and which way fuel prices and tariff policy move next. We do not mix the two. A merchant's calendar runs ahead of the data calendar. The person who buys stock already senses something in last month's order, and the statistics confirm the sense later. Many households reading this page stand behind the counters of retail, wholesale and restaurant businesses. So that we are not late in telling them what they already know, we carry only the confirmed numbers, accurately.